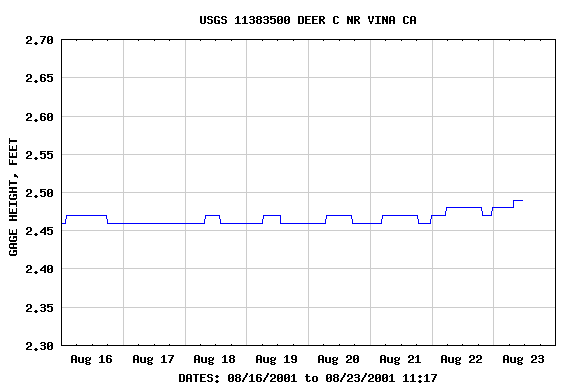
DISCHARGE, CUBIC FEET PER SECOND
| Most recent value: 76 08-23-2001 11:00 | |
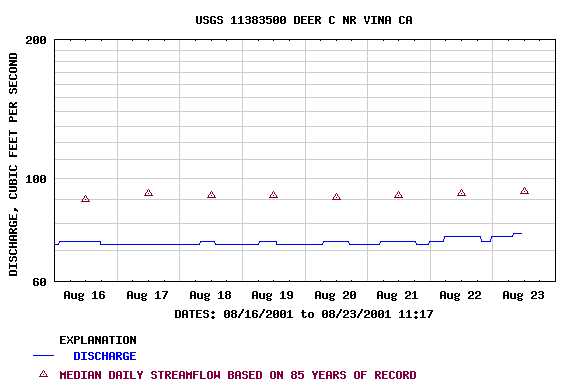 | |
| Download a presentation-quality graph | Parameter Code 00060; DD 01 |
| Current Flow | Minimum | Mean | Maximum | 80 percent exceedence | 50 percent exceedence | 20 percent exceedence |
|---|---|---|---|---|---|---|
| 76 | 53 | 97.2 | 220 | 73.2 | 94.0 | 121 |
|
Percent exceedance means that 80, 50, or 20 percent of all daily mean flows for 8/23 have been greater than the value shown. | ||||||